Ever wonder why your neighbor pays less for car insurance than you do, even though you drive a similar vehicle? Or why your premium jumped at renewal when you didn’t file a single claim? Here’s the truth: insurance rates aren’t random numbers pulled from thin air.
Every insurance company calculates rates by estimating how likely you are to file a claim and how costly that claim might be. Modern pricing relies on actuarial science and massive datasets—decades of accident statistics, weather patterns, medical costs, and claims data. While each insurer has its own proprietary formula, most use similar categories to set insurance rates: personal risk factors, the item being insured, location, coverage level, and claims history.
This article walks you through a step-by-step process to understand how your insurance rate is determined. We’ll focus primarily on auto insurance examples since they’re the most common, but we’ll also cover home, life, and health insurance so you can apply these principles across the board.
What you’ll learn:
Before diving into calculations, let’s get clear on what “insurance rate” actually means for your situation. The term can refer to monthly or annual premiums for auto, home, life, health, or specialty policies like renters, motorcycle, or business coverage. The calculation process differs significantly by type.
Concrete examples:
Each of these uses different rating factors and pricing models. Here’s a quick breakdown to help you identify which part of this article applies to you:

Here’s the formula in plain language that every insurer uses:
Expected annual cost of claims for someone like you + operating costs + profit margin − any discounts = your annual premium
Let’s make this real. Say an auto insurer predicts an average of $400 per year in claims for your profile. They add $200 in expenses and profit margin. Then they apply a 10% discount because you bundled with another policy. Your estimated annual premium comes out to around $540, or roughly $45 per month.
This is where “rating factors” come in. Each factor—your age, driving record, coverage selection, vehicle type—either increases or decreases that expected claims cost. Actuaries use large historical datasets and statistical models to assign relative risk weights to each factor. In 2024, many insurers are using machine learning alongside traditional regression models to refine these predictions.
The key insight: every piece of information you provide during a quote is being fed into this calculation to determine your personal risk level.
Many critical rating variables are tied to you personally—not just your car, home, or health. Some of these you can control over time; others are fixed.
Major personal factors used across multiple insurance types:
Important note: not all factors are allowed in all states. For example, the use of credit scores is restricted in California, Massachusetts, Hawaii, and Michigan for auto insurance premiums.
Age and driving experience influence nearly every major insurance product. They’re among the strongest predictors of claim frequency or severity.
Here’s how it plays out:
For auto specifically, insurers often look at years of driving experience rather than just numerical age. If you were licensed in 2016, that matters more than your birthday.
Your ZIP code is one of the most powerful factors that affect car insurance rates. Insurers use it to group policyholders by local risk—traffic density, theft rates, wildfire exposure, hospital costs, and more.
Geographic examples:
Moving just a few miles can shift your rate tier significantly. Urban areas with more accidents and higher repair costs typically mean higher rates.
Here’s something many people don’t realize: most U.S. auto and home insurers use a credit based insurance score to estimate claim risk. This isn’t your FICO score—it’s a specialized score that predicts how likely you are to file claims.
The impact is real:
That’s a $600 difference for the same coverage on the same vehicle.
Important exceptions: California, Massachusetts, Hawaii, and Michigan ban or tightly restrict credit-based scoring for auto insurance. If you live in these states, your credit won’t directly affect car insurance premiums.
Late payments, collections, and high credit utilization can indirectly raise insurance costs over several years by lowering your insurance score.
Your driving history is a crystal ball for insurers. Past at-fault claims, frequent small claims, and traffic violations typically raise rates for 3-5 years.
Timeline examples:
Accident forgiveness programs can reduce or delay premium increases, but they usually apply only once and only in certain markets. Here’s insider advice: avoiding unnecessary minor claims can keep long-term costs lower. That $300 fender bender you could pay out of pocket? Filing it might cost you more in higher premiums over the next 3-5 years.
Beyond personal factors, the thing being insured has its own risk profile that strongly affects pricing. Insurers analyze attributes like replacement cost, safety features, construction type, and coverage scope.
The vehicle you drive directly impacts your premium rates. Make, model, age, body style, and value all determine collision and comprehensive costs.
Vehicle comparison: | Factor | 2024 Tesla Model 3 | 2014 Honda Civic | |——–|——————-|——————| | Repair costs | Higher (specialized parts) | Lower (widely available parts) | | Theft risk | Moderate | Lower | | Safety features | Advanced ADAS | Basic | | Typical premium | Higher | Lower |
Safety and anti-theft features like automatic emergency braking, lane-keep assist, and GPS tracking can reduce certain portions of your premium or unlock discounts.
Usage patterns matter too:
Dwelling replacement cost—not market price—determines your base coverage and premiums.
2024 example:
Key rating factors:
Upgrades like impact-resistant roofing or modern electrical systems can improve your risk profile and may qualify for discounts.
Term and permanent life insurance rates primarily depend on age, health status, desired death benefit, and policy duration.
Underwriting examples: | Profile | 20-Year Term, $500K | Monthly Premium | |———|———————|—————–| | 30-year-old non-smoker, good health | Standard rate | ~$25-35 | | 50-year-old smoker, high blood pressure | Substandard rate | ~$150-250 |
Insurers may require medical exams, lab work, and access to medical records. Simplified-issue and no-exam policies generally cost more per dollar of coverage because the insurer takes on more risk.
Dangerous hobbies (skydiving, rock climbing) and occupations (commercial pilots, offshore workers) can result in surcharges or exclusions.
Health insurance premiums in 2024 are determined by plan metal level, deductible size, out-of-pocket maximum, and provider network size.
Example comparison:
ACA marketplace plans cannot price by pre-existing conditions, but short-term or off-market plans may underwrite more aggressively. Always look at total expected annual cost (premiums + expected out-of-pocket expenses) rather than just the monthly premium number.
Once personal and asset-based risks are assessed, the largest levers you control are coverage limits, deductibles, and optional add-ons. You’re essentially choosing how much risk you retain versus how much you transfer to the insurer.
Coverage limits vary by product:
Numeric examples:
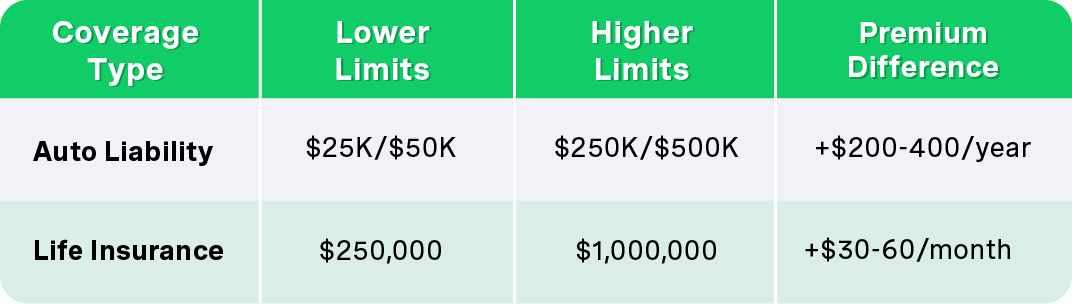
Higher limits mean the insurer may pay more in a worst-case event, so they charge more coverage costs. However, increases aren’t always linear—doubling limits doesn’t always double the cost.
A deductible is what you pay out of pocket on each covered claim before the insurer pays the rest.
Examples across products:
The trade-off: Higher deductibles generally mean lower premiums but increase financial shock if a claim occurs. Lower deductibles raise the premium but smooth out unexpected costs.
Mini case study: Raising an auto deductible from $500 to $1,000 might save $100-150 per year. If you don’t file a claim for 3+ years, you come out ahead. But if you have fewer accidents and a solid emergency fund, this strategy makes sense.
Common auto add-ons:
Home insurance endorsements:
Each increases the premium in exchange for expanded protection. Think carefully about which extras you truly need versus which you can safely decline to keep premiums manageable and save money.
Even if your personal situation doesn’t change, broader trends can raise or lower rates across entire regions. This is why you might see rate increases not tied to any personal change.
Rising prices for auto parts, construction materials, and skilled labor directly increase claim payouts.
Real-world examples:
Insurers use recent 2-3 year cost trends when forecasting future claim expenses. A spike from 2021-2023 directly influences premiums set in 2024 and 2025.
Repeated major events—Hurricanes Harvey, Ida, Ian, and California wildfires—have led insurers to revise risk estimates for entire regions.
What’s happening in 2024:
A homeowner in coastal Louisiana might see a 40%+ premium jump between 2020 and 2024 with no claims and no changes to their property—purely due to regional risk reassessment.
Here’s a practical process you can follow in 2024 to approximate your likely rate range before formally shopping:
Mini-example: A 35-year-old driver in Denver, Colorado with a 2019 Toyota RAV4, clean driving record, good credit, and 12,000 miles per year. Running quotes from 5 different insurers with mid-range coverage (100/300/100 liability, $500 deductibles) might show annual premiums ranging from $1,100 to $1,600. That $500 spread is real money.
For auto insurance:
For home insurance:
For life and health:
Many insurers and comparison sites offer free quote estimators that provide ballpark numbers in minutes. Run multiple scenarios—different deductibles, different limits—to see how sensitive the rate is to your coverage choices.
Pro tip: Record results in a simple table:

This visual comparison helps you identify outliers and find the best value.
While some rating factors are fixed (age, past claims), many can be improved over time or managed through smart coverage design.
Main tactics:
Some changes lead to larger drops (violation falling off after 3 years), while others yield smaller discounts (installing one safety device). Set realistic expectations.
Actions for the next 6-12 months:
Example: Switching to a slightly higher-deductible health plan if you rarely use medical services can yield significant savings on monthly premiums.
Warning: Don’t underinsure critical risks just to save a few dollars per month. Drastically lowering liability limits might save $20/month but expose you to financial catastrophe in a serious accident.
Improvements that take time but have lasting impact:
Schedule regular annual reviews at each renewal date. Update your insurer on positive changes: fewer miles driven, added safety systems, home upgrades. Insurance rates are dynamic and can improve if your risk truly goes down.
Insurance rates aren’t arbitrary numbers—they reflect measured risk factors, coverage choices, and broader market conditions. Understanding how car insurance rates determined and how other insurance products are priced puts you in control.
The key levers you can control:
Treat rate determination as an ongoing process. Revisit major policies after life events—new car, move, marriage, home purchase, employment status change—and at least once per year at renewal.
Now it’s on you: gather your information, estimate your likely rate range, then request multiple quotes. The difference between paying attention and just auto-renewing can mean hundreds of dollars in your pocket each year. That’s real money you could be saving instead of overpaying for coverage you don’t need or missing discounts you qualify for.
Compare & get covered fast
Find and compare auto insurance in minutes, and get your free credit score.
Choose when you pay
Select payment dates that line up with your payday.
Manage everything in one place
Track your policy, manage payments, and request a payment extension right from your dashboard.

.svg)